


How do you graph \[ - 2\ln x\]?
Answer
546.3k+ views
Hint: We use the given equation and assume it as a new variable. Substitute the value of ‘x’ and calculate the corresponding value of ‘y’ from the equation. Similarly, we can substitute values for ‘y’ and calculate the corresponding values for ‘x’ using the equation.
Complete step by step solution:
We have equation \[ - 2\ln x\]
Let us assume the equation as a variable say ‘y’
Then \[y = - 2\ln x\] … (1)
We can divide both sides of the equation (1) by -2
\[ \Rightarrow \dfrac{y}{{ - 2}} = \dfrac{{ - 2\ln x}}{{ - 2}}\]
\[ \Rightarrow \dfrac{y}{{ - 2}} = \ln x\]
Take exponential function on both sides of the equation
\[ \Rightarrow {e^{\dfrac{y}{{ - 2}}}} = x\]
\[ \Rightarrow x = {e^{ - \dfrac{y}{2}}}\] … (2)
We will substitute the value of ‘y’ in the right hand side of equation (2) and calculate the corresponding value of ‘x’.
Put \[y = 0\]
Then \[x = {e^{ - \dfrac{0}{2}}}\]
i.e. \[x = {e^0} = 1\]
Point becomes \[(1,0)\]
Put \[y = - 2\]
Then \[x = {e^{ - \dfrac{{ - 2}}{2}}}\]
i.e. \[x = {e^1} = e\]
Point becomes \[(e, - 2)\]
Now we plot the points \[(1,0)\]and \[(e, - 2)\] on the graph.
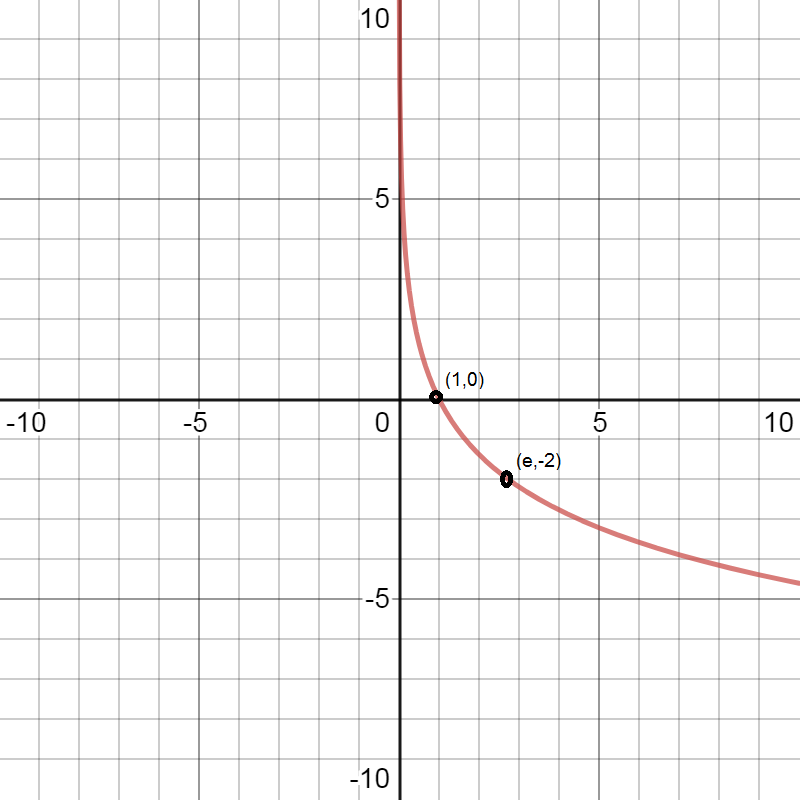
\[\therefore \]The graph of the equation \[ - 2\ln x\] can be made by plotting the points \[(1,0)\]and \[(e, - 2)\] and joining the line through these two points.
Note: Students are likely to make mistakes while shifting the values from one side of the equation to another side of the equation as they forget to change the sign of the value shifted. Keep in mind we always change the sign of the value from positive to negative and vice versa when shifting values from one side of the equation to another side of the equation. When plotting the points on the graph many students tend to mark wrong points due to the scale, keep in mind we can adjust the scale of the graph according to our need.
Alternate method:
Let us assume \[y = - 2\ln x\]
Then we can write \[y + 2\ln x = 0\]
Take exponential function on both sides
\[ \Rightarrow {e^{y + 2\ln x}} = {e^0}\]
Then use the property of exponentials i.e. \[{e^{x + y}} = {e^x}.{e^y}\]
\[ \Rightarrow {e^y}.{e^{2\ln x}} = {e^0}\]
Substitute the value of \[{e^0} = 1\]and use log property \[ \Rightarrow m\ln x = \ln {x^m}\]
\[ \Rightarrow {e^y}.{e^{\ln {x^2}}} = 1\]
Cancel exponent by log
\[ \Rightarrow {e^y}.{x^2} = 1\]
\[ \Rightarrow {e^y} = \dfrac{1}{{{x^2}}}\]
When \[y = 0\]
\[ \Rightarrow {x^2} = 1\]
So, \[x = 1\]
Point becomes \[(1,0)\]
When \[y = - 2\]
Then \[x = {e^{ - \dfrac{{ - 2}}{2}}}\]
i.e. \[x = {e^1} = e\]
Point becomes \[(e, - 2)\]
Now we plot the points \[(1,0)\]and \[(e, - 2)\] on the graph.

\[\therefore \]The graph of the equation \[ - 2\ln x\] can be made by plotting the points \[(1,0)\]and \[(e, - 2)\] and joining the line through these two points.
Complete step by step solution:
We have equation \[ - 2\ln x\]
Let us assume the equation as a variable say ‘y’
Then \[y = - 2\ln x\] … (1)
We can divide both sides of the equation (1) by -2
\[ \Rightarrow \dfrac{y}{{ - 2}} = \dfrac{{ - 2\ln x}}{{ - 2}}\]
\[ \Rightarrow \dfrac{y}{{ - 2}} = \ln x\]
Take exponential function on both sides of the equation
\[ \Rightarrow {e^{\dfrac{y}{{ - 2}}}} = x\]
\[ \Rightarrow x = {e^{ - \dfrac{y}{2}}}\] … (2)
We will substitute the value of ‘y’ in the right hand side of equation (2) and calculate the corresponding value of ‘x’.
Put \[y = 0\]
Then \[x = {e^{ - \dfrac{0}{2}}}\]
i.e. \[x = {e^0} = 1\]
Point becomes \[(1,0)\]
Put \[y = - 2\]
Then \[x = {e^{ - \dfrac{{ - 2}}{2}}}\]
i.e. \[x = {e^1} = e\]
Point becomes \[(e, - 2)\]
Now we plot the points \[(1,0)\]and \[(e, - 2)\] on the graph.
\[\therefore \]The graph of the equation \[ - 2\ln x\] can be made by plotting the points \[(1,0)\]and \[(e, - 2)\] and joining the line through these two points.
Note: Students are likely to make mistakes while shifting the values from one side of the equation to another side of the equation as they forget to change the sign of the value shifted. Keep in mind we always change the sign of the value from positive to negative and vice versa when shifting values from one side of the equation to another side of the equation. When plotting the points on the graph many students tend to mark wrong points due to the scale, keep in mind we can adjust the scale of the graph according to our need.
Alternate method:
Let us assume \[y = - 2\ln x\]
Then we can write \[y + 2\ln x = 0\]
Take exponential function on both sides
\[ \Rightarrow {e^{y + 2\ln x}} = {e^0}\]
Then use the property of exponentials i.e. \[{e^{x + y}} = {e^x}.{e^y}\]
\[ \Rightarrow {e^y}.{e^{2\ln x}} = {e^0}\]
Substitute the value of \[{e^0} = 1\]and use log property \[ \Rightarrow m\ln x = \ln {x^m}\]
\[ \Rightarrow {e^y}.{e^{\ln {x^2}}} = 1\]
Cancel exponent by log
\[ \Rightarrow {e^y}.{x^2} = 1\]
\[ \Rightarrow {e^y} = \dfrac{1}{{{x^2}}}\]
When \[y = 0\]
\[ \Rightarrow {x^2} = 1\]
So, \[x = 1\]
Point becomes \[(1,0)\]
When \[y = - 2\]
Then \[x = {e^{ - \dfrac{{ - 2}}{2}}}\]
i.e. \[x = {e^1} = e\]
Point becomes \[(e, - 2)\]
Now we plot the points \[(1,0)\]and \[(e, - 2)\] on the graph.
\[\therefore \]The graph of the equation \[ - 2\ln x\] can be made by plotting the points \[(1,0)\]and \[(e, - 2)\] and joining the line through these two points.

Recently Updated Pages
Master Class 9 General Knowledge: Engaging Questions & Answers for Success
Master Class 9 Social Science: Engaging Questions & Answers for Success
Master Class 9 English: Engaging Questions & Answers for Success
Master Class 9 Maths: Engaging Questions & Answers for Success
Master Class 9 Science: Engaging Questions & Answers for Success
Class 9 Question and Answer - Your Ultimate Solutions Guide
Trending doubts
Difference Between Plant Cell and Animal Cell
Fill the blanks with the suitable prepositions 1 The class 9 english CBSE
Who is eligible for RTE class 9 social science CBSE
Which places in India experience sunrise first and class 9 social science CBSE
What is pollution? How many types of pollution? Define it
Name 10 Living and Non living things class 9 biology CBSE