Introduction to Micro Economics Class 12 important questions with answers PDF download
FAQs on CBSE Important Questions for Class 12 Economics Introduction to Micro Economics - 2025-26
1. What are the most important questions from Chapter 1, Introduction to Microeconomics, for the CBSE Class 12 Board Exam 2025-26?
For the CBSE 2025-26 board exams, the most important questions from this chapter focus on fundamental concepts. Students should prioritise:
- The three central problems of an economy: 'What', 'How', and 'For whom' to produce (often asked for 3-4 marks).
- Production Possibility Curve (PPC): Its properties, shifts, and rotation. Questions on why it is concave are very common (4-6 marks).
- Opportunity Cost: Its definition and calculation, often explained with a numerical example (1-3 marks).
- Difference between Microeconomics and Macroeconomics: A classic distinction question (3-4 marks).
- Positive vs. Normative Economics: Understanding the difference with examples (1-3 marks).
2. Explain the three central problems of an economy: 'What to produce?', 'How to produce?', and 'For whom to produce?'.
Every economy faces three fundamental or central problems due to the scarcity of resources:
- What to produce and in what quantities?: This involves choosing which goods and services to produce (e.g., consumer goods like rice and wheat vs. capital goods like machinery) and deciding the quantity of each.
- How to produce?: This refers to selecting the technique of production. An economy must choose between labour-intensive techniques (using more labour) and capital-intensive techniques (using more machinery).
- For whom to produce?: This problem is about the distribution of the produced goods and services among the population. It deals with how the national product is shared among different households.
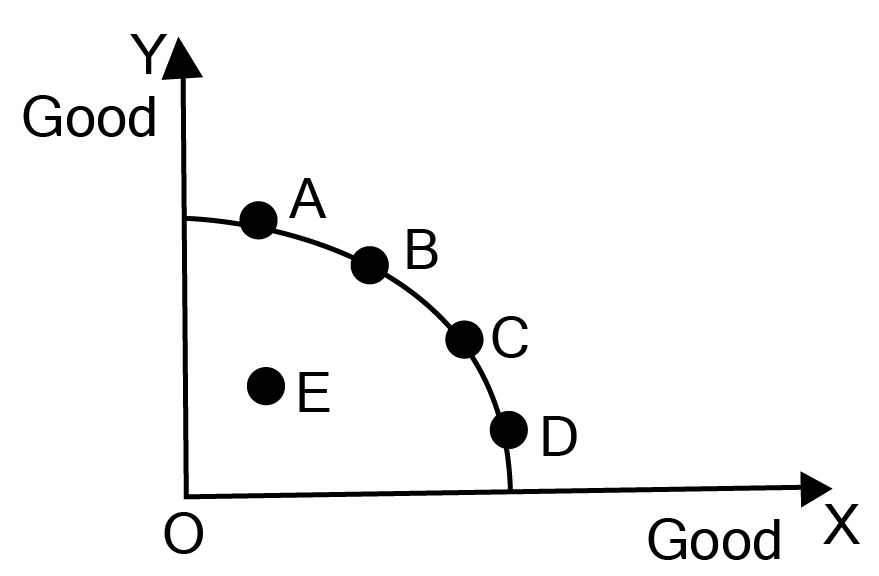
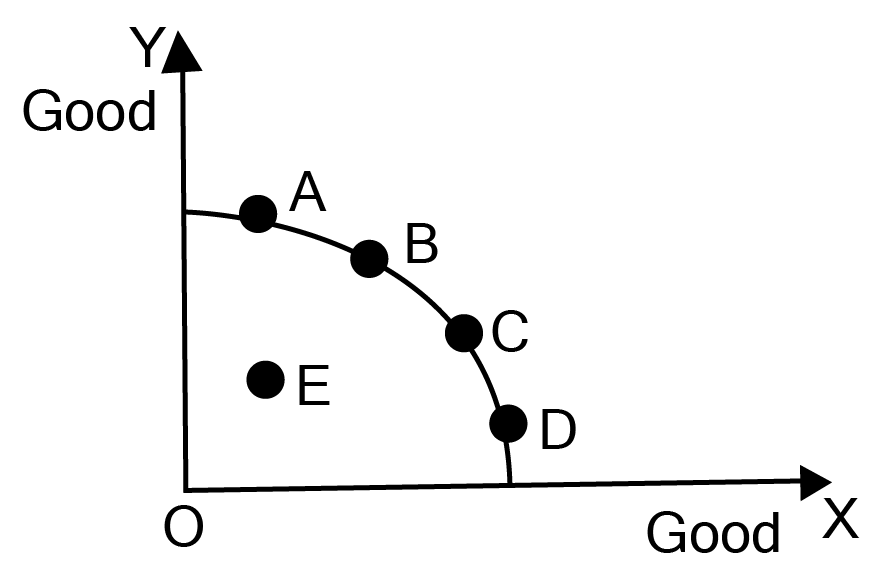
3. Why is the Production Possibility Curve (PPC) concave to the origin? What economic principle does this illustrate?
The Production Possibility Curve (PPC) is concave to the origin because of the increasing Marginal Rate of Transformation (MRT), which in turn is based on the principle of increasing opportunity cost. This happens because resources are not equally efficient in the production of all goods. To produce more of one good (Good X), more and more units of the other good (Good Y) have to be sacrificed. This is because resources that are best suited for producing Good Y are gradually transferred to produce Good X, leading to a fall in their productivity.
4. How would you distinguish between a centrally planned economy and a market economy for a board exam answer?
To distinguish between a centrally planned economy and a market economy, you should focus on these key points:
- Ownership of Resources: In a planned economy, resources are owned by the state or a central authority. In a market economy, resources are primarily owned by private individuals.
- Economic Decisions: In a planned economy, all key economic decisions are made by the government or a central planning authority. In a market economy, decisions are driven by the market forces of demand and supply.
- Primary Motive: The main objective of a planned economy is social welfare. For a market economy, the primary motive is profit maximization.
- Consumer's Role: The consumer is not sovereign in a planned economy. In a market economy, the consumer is considered sovereign, as production is guided by consumer preferences.
5. What is 'opportunity cost'? Explain this concept with a suitable numerical example.
Opportunity cost is the value of the next-best alternative that must be forgone to pursue a certain action. It is the cost of the missed opportunity.
Example: Suppose a person has three job offers: Job A with a salary of ₹50,000, Job B with a salary of ₹60,000, and Job C with a salary of ₹70,000. If the person chooses Job C (the highest salary), the opportunity cost is the value of the next-best alternative, which is the salary from Job B. Therefore, the opportunity cost of accepting Job C is ₹60,000.
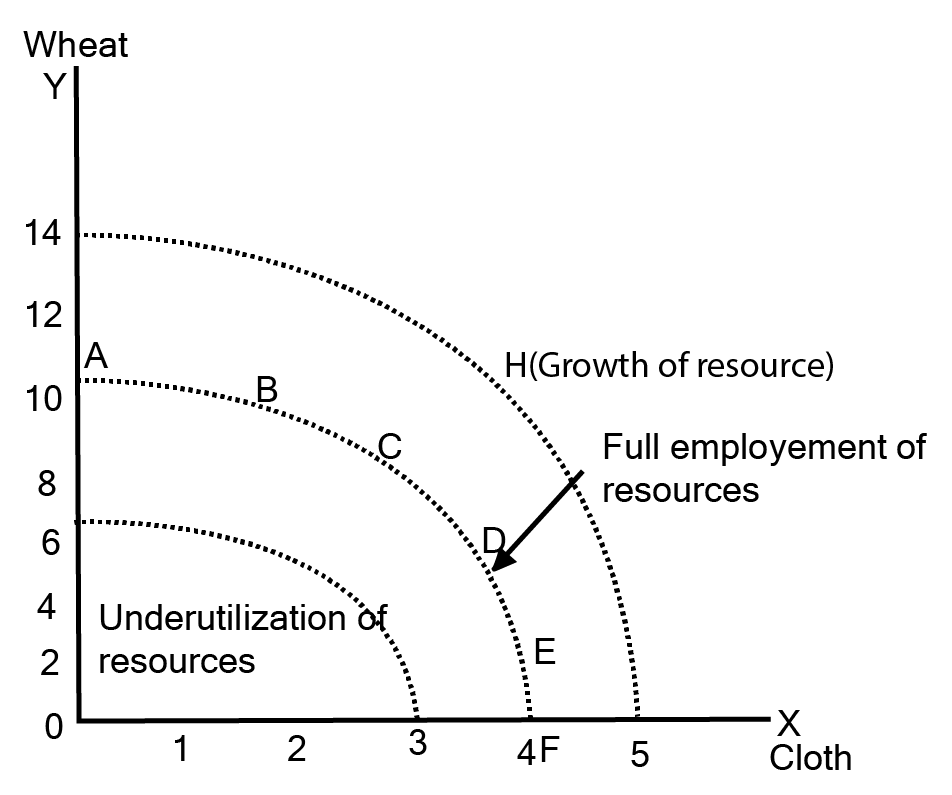
6. How does a Production Possibility Curve (PPC) illustrate the concepts of scarcity, resource underutilisation, and economic growth?
A PPC is an excellent tool to illustrate core economic concepts:
- Scarcity: The PPC itself, which is a boundary, represents the limit of what can be produced with available resources. Any point beyond the curve is unattainable, thus depicting the problem of scarcity.
- Resource Underutilisation: Any point inside the PPC signifies that resources are not being used efficiently or are unemployed. At such a point, the economy can increase the production of one or both goods with existing resources.
- Economic Growth: A rightward shift of the entire PPC indicates economic growth. This happens due to an increase in resources (like more labour or capital) or an improvement in technology, allowing the economy to produce more of both goods.
7. Does large-scale unemployment cause the PPC to shift inwards? Explain this common point of confusion.
No, large-scale unemployment does not cause the PPC to shift inwards. This is a common misconception. The PPC represents the potential output of an economy if all resources are fully and efficiently employed. Unemployment signifies that the existing resources are being underutilised. Therefore, unemployment would be represented by a point inside the PPC, not a shift of the curve itself. A leftward shift only occurs if the economy's actual productive capacity decreases, for example, due to a natural disaster or degradation of technology.
8. Explain the difference between positive economics and normative economics with examples relevant to CBSE Class 12.
The key difference lies in their approach to economic issues:
- Positive Economics deals with what is, what was, or what will be. It describes economic phenomena as they are, based on facts and data. These statements are verifiable. For example, "The inflation rate in India is 6%."
- Normative Economics deals with what ought to be. It involves value judgements and opinions on how the economy should work. These statements are not verifiable. For example, "The government should implement policies to reduce inflation below 4%."
This distinction is crucial for evaluating economic policies objectively versus subjectively.
9. What is the significance of the Marginal Rate of Transformation (MRT) in the context of the CBSE board exam?
The Marginal Rate of Transformation (MRT) is significant because it represents the slope of the PPC and quantifies opportunity cost. For board exams, its importance is:
- It is the rate at which an economy must give up units of one good to produce one additional unit of another good, assuming full resource utilisation.
- An increasing MRT is the reason for the concave shape of the PPC, a frequently asked question.
- In exams, MRT is often tested through numerical problems where students must calculate it from a production schedule, or through diagram-based questions requiring an explanation of the PPC's slope.
10. What are some common mistakes to avoid when answering diagram-based questions about the PPC in the board exam?
To score full marks in PPC-related diagram questions, students must avoid these common errors:
- Incorrect Labelling: Forgetting to label the X-axis, Y-axis, the goods being produced, and the curve itself (PPC).
- Wrong Shape: Drawing the PPC as a straight line or convex, instead of its correct concave shape to the origin.
- Confusing a Shift with Movement: A movement along the curve shows a reallocation of resources between two goods. A shift of the entire curve shows a change in productive capacity (growth or decline). Confusing these is a major conceptual error.
- Improperly Marking Points: Not clearly marking points representing underutilisation (inside the curve), full utilisation (on the curve), and unattainable combinations (outside the curve).


